Zigbee Health
Zigbee Health provides a dashboard to give insight into the Zigbee health, summary, and project improvements and a detailed list of Zigbee devices in the project with troubleshooting information.
Zigbee Health Dashboard
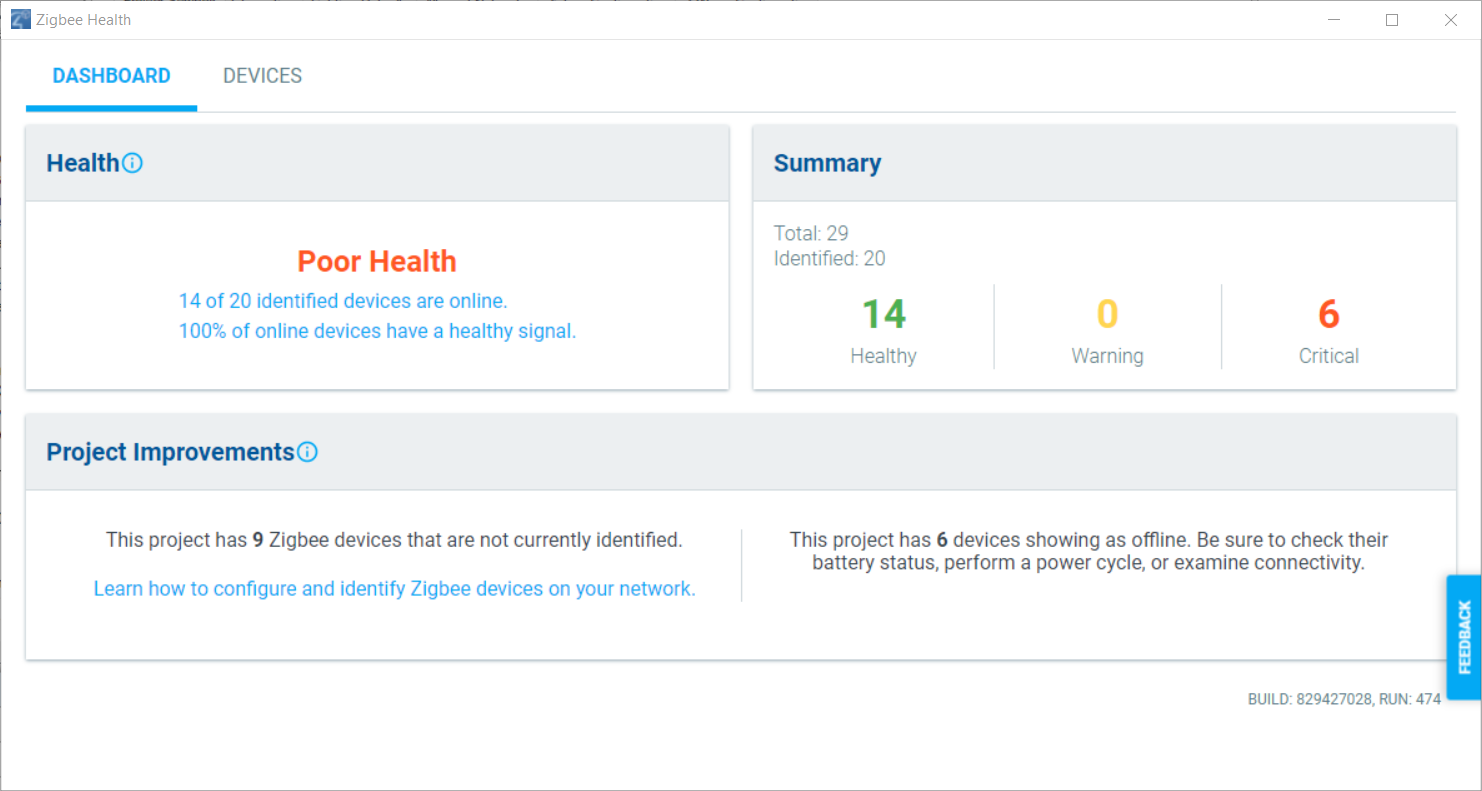 TThe Zigbee Health Dashboard has three main sections: Health, Summary, and Project Improvements.
- The Health grade is based on devices that are online and devices that have a strong and consistent signal.
- The Summary gives more details on how the grade is calculated by breaking down total devices in the project, how many are identified, and how many are in a Healthy, Warning, or Critical status. Devices that are offline or have extremely poor signal show as Critical. Devices that have communication errors, but are online, show as Warning. Devices that are online and with good connectivity strength show as Healthy.
- Project Improvements gives suggestions to improve the Zigbee health of the project. The number of devices that are not identified and that are offline are listed.
Zigbee Health Devices
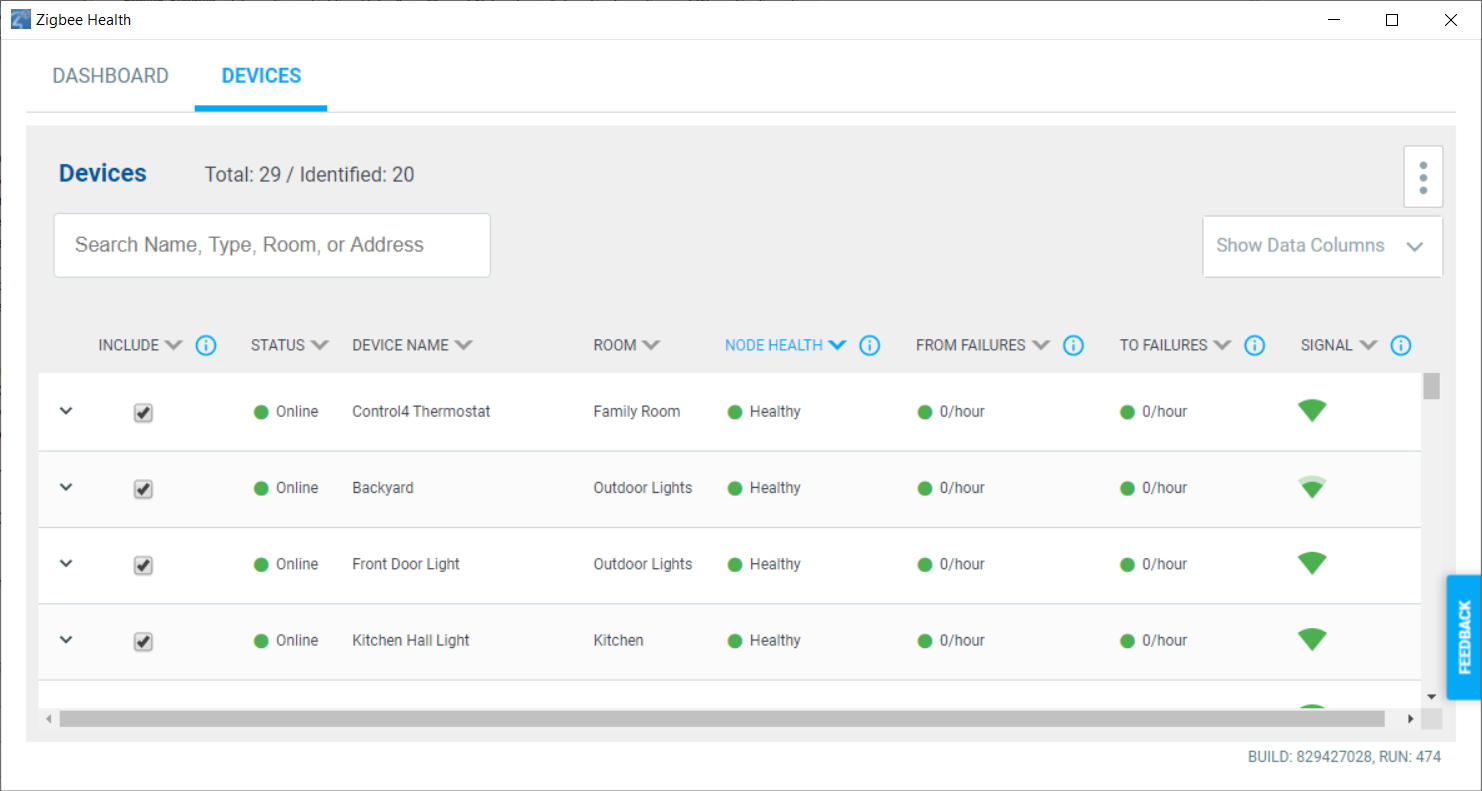 The Zigbee Health Devices tab gives details on the Zigbee devices in the project.
Tip: You can sort by each column by clicking on the column name.
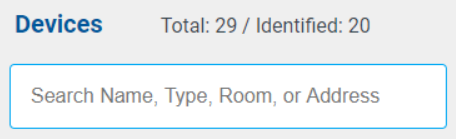
- Search—The Search bar lets you enter the device name, room in the project, device type, or MAC address of a Zigbee device and filter the Devices list.

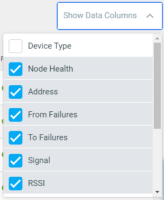
- Show Data Columns—Click on the Show Data Columns dropdown menu to choose which data columns to display in the device list: Device Type, Node Health, Address, From Failures, To Failures, Signal, and RSSI.
- Include—De-select a device in the Include column to not include that device in the Zigbee Health Dashboard grade. For example, if you have an outlet switch that you use for Christmas tree lights that gets put away most of the year, deselect the outlet switch so it doesn't lower your Zigbee Health grade.
- Status—Shows a green dot for online status, red dot for offline status, or gray dot for offline status if the device is not identified.
- Device Name—The device name given to the driver in System Design.
- Room—In System Design, the room the device is located in.
- Node Health—A combination of factors is used to give each device a node health grade.
- Address—The MAC address of the Zigbee device if it has been identified into the system.
- From Failures—Average message failures, per hour, from device to mesh controller since the last time Zserver was started or counts were cleared with a data reset. Normal ranges are 50 or fewer per hour. Signal interference or distance can negatively impact this value. From the menu, click on Reset Counts:<name of mesh controller> to reset the data.
- To Failures—Average message failures, per hour, from mesh controller to device since the last time Zserver was started or counts were cleared with a Data Reset. Normal ranges are 50 or fewer per hour. Signal interference or distance can negatively impact this value. From the menu, click on Reset Counts:<name of mesh controller> to reset the data.
- Signal—An icon to rate the signal strength: from green full bars for very good signal to red empty bars for poor signal. Interference or distance can negatively impact signal strength.
- RSSI—Received Signal Strength Indicator (RSSI) is a negative numerical value in dBm that measures signal strength. Negative numbers closer to zero are better (-40 dBm is better than -65 dBm). What is considered normal varies from device to device, so only compare RSSI values from like devices (manufacturer and model). Values range from -100 (soft) to 0 (loud). Signal interference or distance can negatively impact this value.