Viewing controller performance information
Use the System Diagnostics tool (Tools menu > System Diagnostics) to view controller performance.
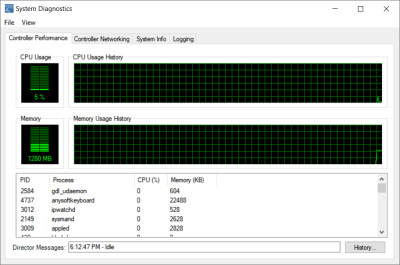
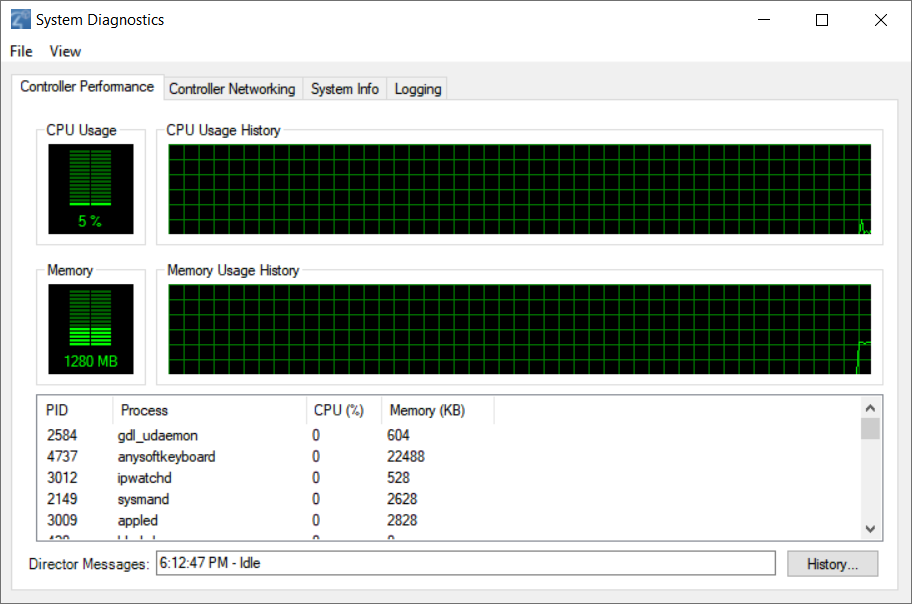
The Controller Performance tab contains information regarding CPU and memory utilization for the Primary Controller of the project. Asynchronous messages from the Director regarding its current state are also displayed.
To view controller performance information, including CPU and memory usage:
- Start Composer Pro and connect to a Director.
- From the Tools menu, select System Diagnostics. The Controller Performance tab is viewable by default.
- View information displayed on the Controller Performance tab:
- CPU Usage—Shows a graphical form of current CPU usage and CPU usage history for the primary controller, which is the Control4 controller used to control the system if multiple controllers exist on a system.
- Memory Usage—Shows in graphical form the current memory usage and memory history for the primary controller.
- CPU and Memory Usage by Component—Shows percentages of CPU and memory use per component.
- Refresh the screen or update the speed. To do this, from the View menu you can:
- Refresh Now—Restart the real-time display of CPU and Memory usage.
- Update Speed—Change the speed to High, Normal, Low, or Paused.
- View the Directory messages by clicking the History button.