Logging diagnostics information
Use the System Diagnostics tool (Tools menu > System Diagnostics) to use the logging feature and log files.
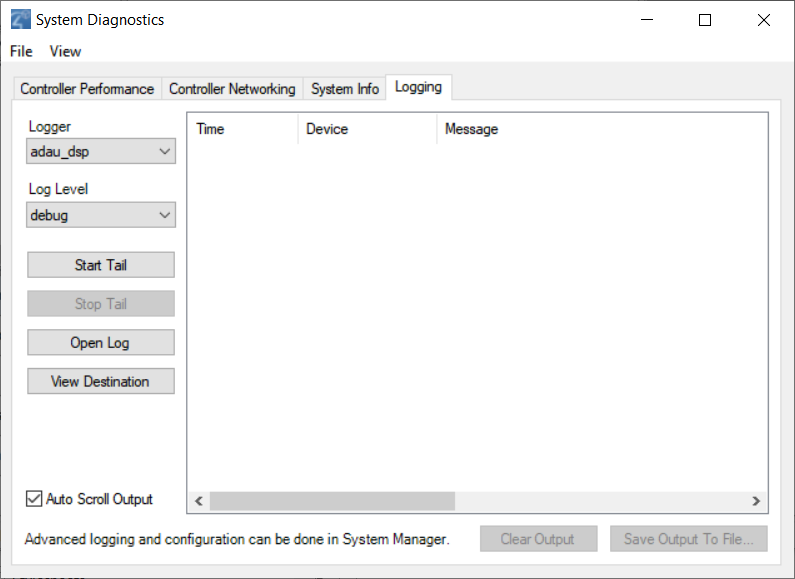
View Logging to configure, start, stop, and schedule diagnostic logging of the Control4 system.
- Capturing Information While Reproducing a Problem—When troubleshooting a problem that is reproducible, use the System Diagnostics tool to capture logged information while reproducing the problem to email to Control4 Technical Support.
- Enabling Logging for Debugging—When troubleshooting a problem that is not reproducible, connect to the controller, enable logging, and allow the logging to continue running for a specified period of time to capture the problem. The logs are then captured and emailed to Control4 Technical Support.
- Zigbee and I/O Communications—These items are available for logging in System Diagnostics.
- DirectorState.corrupt—If for any reason Director is unable to load a project file, it is saved to DirectorState.corrupt prior to loading a clean project file (Tools > System Diagnostics > Logging).
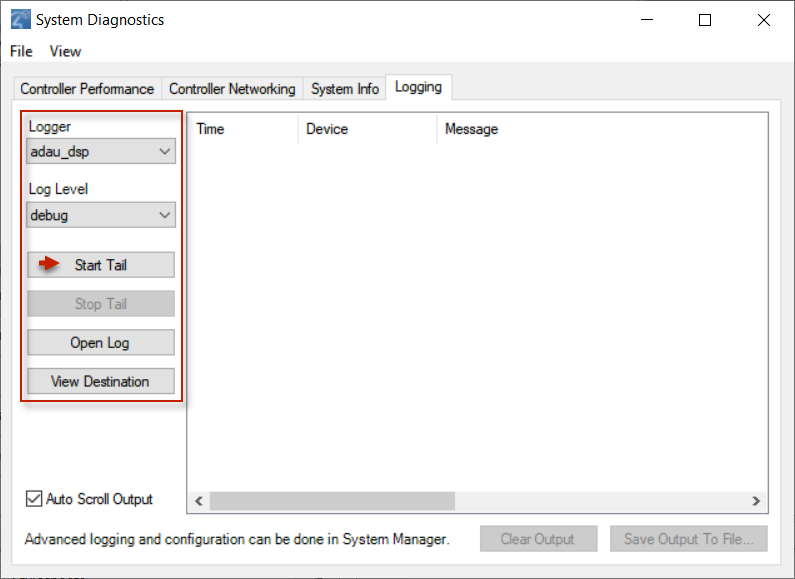
To use system logging:
- Start Composer Pro and connect to a Director.
- From the Tools menu, select System Diagnostics, and then click the Logging tab.
- To enable logging, select the logging categories and click Start Tail
- The results are displayed.
- (Optional) To save the log, but continue logging the results, click Clear Output. The logging feature remains enabled, but a Save As dialog box lets you specify the location and name of the text version of the log.
- (Optional) To save the log and disable the logging process, click Stop Logging. The logging feature is disabled, but a Save As dialog box lets you specify the location and name of the text version of the log.
- To view the controller Log, click Open Controller Log.